
Show analytics and reports
See how visitors use your Homebase, and build and export reports on any show data.
Map D tracks how visitors use your Homebase, floor plan and mobile app, and lets you export any of your show data as a spreadsheet.
Show analytics
Open your show dashboard and select the Analytics tab:
| Tab | What it shows |
|---|---|
| Show Stats | Total views and visitors, visits during the event dates, device types, and which pages and sections people visit. |
| Exhibitors, Sponsors, Sessions, Speakers, Attendees | The most viewed of each, and the share of each that was viewed. |
| Exhibitor Engagement | Profile views, tab views and link clicks across all exhibitors, and per exhibitor. |
Views in your show's mobile app count alongside your website's. Show Stats splits them under Website and Mobile App, and the exported files mark each row's source as web or app.
Select Download all tracking data or Download engagement data for the raw figures as a CSV file.
Visits from your previous platform
If your show moved to Map D from your previous platform, Show Stats ends with a section called From your previous platform. It shows what that platform recorded: Total Views and Total Unique Devices for the entire life of the show and during the show dates, visits during the event dates, visits by device type, the most viewed exhibitors, and all page visits. The dates it covers are at the top of the section.
These figures are kept apart from Map D's own and are never added to them, so the numbers above the section only count visits since your show moved. They come over as daily totals: the downloads include only Map D's own visits.
In an exhibitor's figures under Exhibitor Engagement, the same section shows that exhibitor's profile views on your previous platform.
Reports
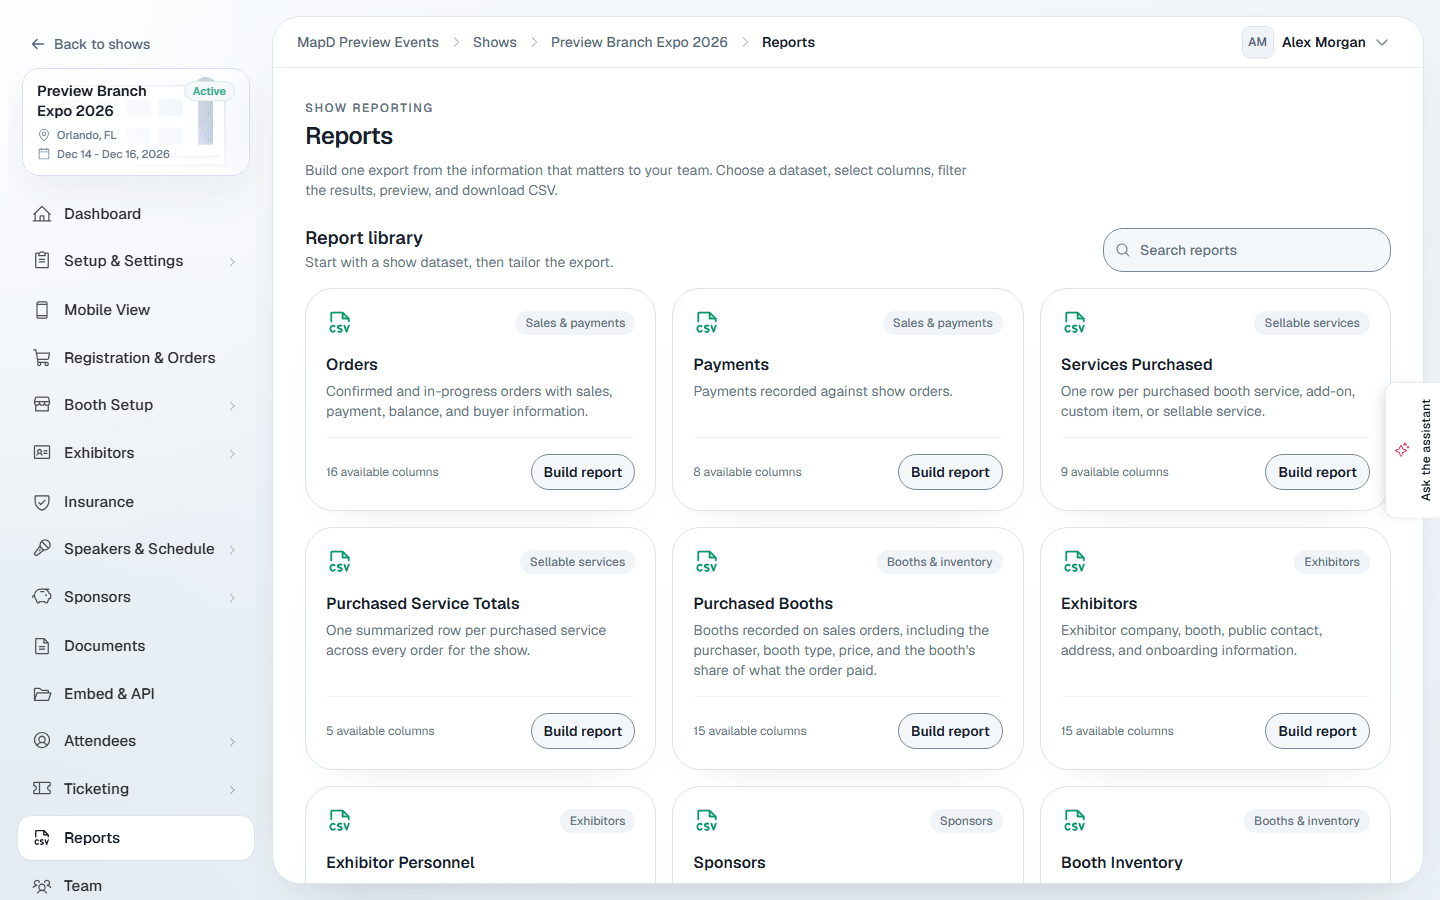
Open Reports in the show sidebar for ready-made reports, grouped into analytics, attendees and tickets, booths and inventory, exhibitors, sales and payments, speakers and schedule, services, and sponsors. Which ones you see depends on what your show includes.
Build a report
Choose a report or select Build report
Pick a report from the library, or build your own from a Dataset.
Pick the columns
Tick the fields you want. They appear in the export in the order shown.
Filter and sort
Filter on a field with contains, equals or does not equal, and choose a sort order.
Preview and export
Preview shows the first 50 rows. Export CSV downloads the full report.
A report reads up to 20,000 records. On a show larger than that, the preview says the report may be missing some, and so does a message when you export. Add filters to narrow it.
Saved reports
Saved reports, above the library, lists reports set up for this show and those marked All shows, which appear in every one of your shows and run on the show you open them from. Select one to open it with its columns, filters and sort already chosen.
One row per exhibitor
The Exhibitors report can hold everything about each exhibitor in one row. Besides the company, booth and public contact, you can tick the admin contact (Admin First Name, Admin Email and the rest), Portal Login Email, social links, Description, Keywords, Internal Notes and Date Added. Booth Type and Booth Dimensions cover every booth the exhibitor holds.
If you can see sales, you can also add Booth Price and order totals across the exhibitor's orders: Order Numbers, First Order Date, Booths Total, Services Total, Discount Total, Fees Total, Order Total, Payments Total and Order Balance. Canceled orders are left out. Team members without access to sales don't see these columns.
Floor space and discount reports
- Booth Type Totals gives one row per booth type: how many booths are Occupied, Available or Not Available, their Square Feet, the Occupied % of the floor space, and the value of the booths at their prices. A booth counts as occupied once it is sold or has an exhibitor on it, and as not available while it is held in a cart, marked unavailable or not for sale. Square feet are measured from each booth as drawn on the map, so L-shaped and round booths count only the floor they cover.
- Discount Code Usage gives one row per discount code or quantity discount: how many Orders used it and the Discount Total it took off. Canceled orders are left out.
For booth sales in particular, the Export CSV on your show dashboard and Export Options on the Orders tab give you quick order exports. See Manage orders and payments.
Still need help?
Contact your Map D account team. Include your show name and, if something looks wrong, a screenshot of the page.
Last updated September 30, 2026